Exclusive List Of Top Trends For The PV Industry (2020)
More cost-effective production, faster innovation, smarter consumers, and raising awareness of global warming, are just a few aspects regarding PV energy trends that could boost the development of solar photovoltaic systems in 2020.
The photovoltaic (PV) sector is growing at an increasingly rapid rate. With constant changes in terms of technology, price, efficiency, and capacities, it can be challenging to figure out what the next year (and decade) will bring. Multiple questions arise such as:
Electricity demand and prices are continuously rising. What does it mean for PV?
2019 was marked by a price decrease of almost 8%. What will be the price level for 2020?
China, the most prominent player, has started to lower feed-in-tariffs this year, will other countries follow? What will the consequences be for next year?
Production cost is decreasing, while capacity and efficiency are increasing year by year. PERC technology has recently been introduced to the photovoltaic market meaning PERC cells are quickly becoming the new standard. What new technologies can we expect next?
We have written this comprehensive article to give a clearer overview of the key drivers and challenges affecting the PV industry. We will cover different trends; from the latest PV industry tendencies to consumer behaviour.
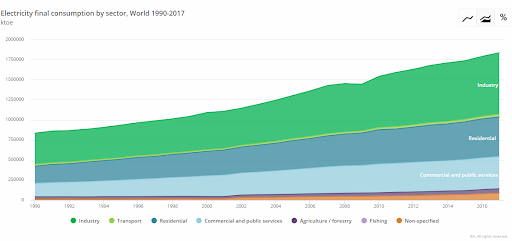
Trends in Electricity consumption and production
The demand for energy is steadily increasing worldwide, particularly for electrical energy. From 1990 till 2017, final electricity consumption increased by 217% and the trend does not seem likely to stall in the future. Therefore, electrical energy systems must be able to produce enough electricity to cover year around consumption 24/7. . We will cover different trends; from the latest PV industry tendencies to consumer behaviour.
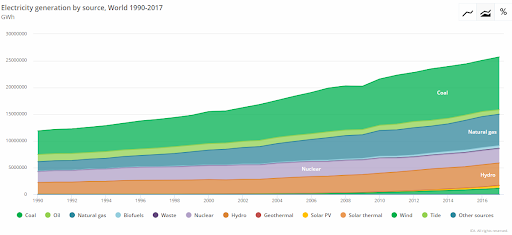
Power plants using coal or natural gas as fuel were the dominant way to supply electricity reliably and economically for many years. Fossil fuels are cheap and easily extracted, but on the other hand, they create great amounts of CO2 gas and other harmful substances during the ignition process. We do not need to discuss the consequences of the situation of conventional energy sources further, governments and the general public are acting to positively change this situation.
The raising awareness concerning climate change and its risks has significantly reduced the number of new coal or natural gas power plants being built. In 2017 the growth of coal power plant production was only 23% compared to 2010.
Year-on-year change in annual global electricity production from coal and natural gas with 1990 as reference (IEA)
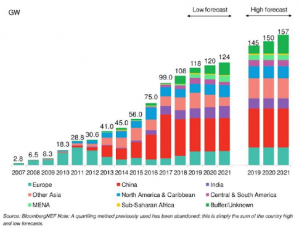
BNEF Forecast of PV installs through 2021 (PV Tech)
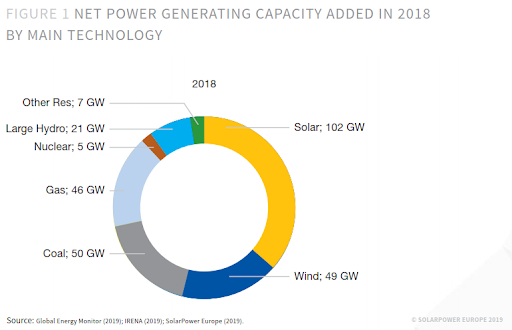
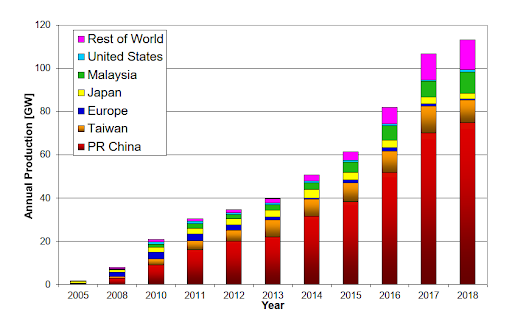
Simultaneously, to address global warming and satisfy the growing demand in electricity, the installation of “cleaner” sources such as Solar PV or wind power has been adopted as the ideal solution. In 2018 (also expected in 2019), the world’s Solar PV capacity combined will be over 100 GW per year. As a means of comparison, in 2009, just a decade ago, the capacity per year was only about 10 GW.
However, the capacity of installed Solar PV systems is not distributed evenly around the world. China is the most significant player, followed by the EU, the US and several Asian countries such as Japan and India. According to the Bloomberg NEF report, in the next couple of years, Solar PV capacity will continue to grow, but at a slower rate than before. China, with its lower feed-in-tariffs will reduce its growth rate, but the EU, on the other hand, will rush to reach its 2020 targets.
Trends in PV solar module price
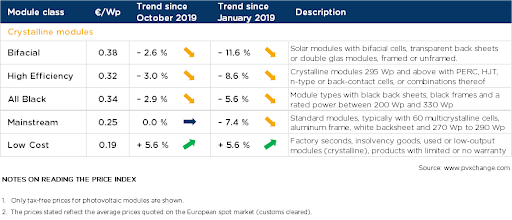
One of the main trends that keep encouraging Solar PV installations, is a significant drop in solar module prices. During 2019 we observed the price reduction of all main types of PV modules, with some units decreasing more than 10% in price since January 2019. Though whether prices will continue to fall in 2020 is hard to say. Even if the production cost of higher efficiency technology will be declining steadily, prices will remain stable for some time. Indeed, manufacturers will want to take advantage of the lower production expenses.
PV module price index in November 2019 (PV Xchange)
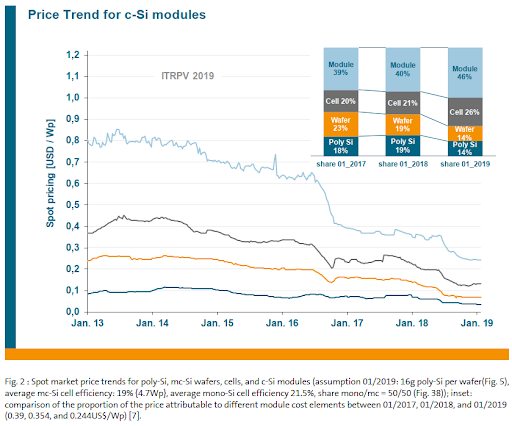
Price Trend for crystalline Silicon modules (ITRP)
Trends in Feed-in-tariff and LCOE
Solar PV development still needs support from governments and one of the most popular methods is Feed-in-tariff (FiT). The so-called FiT means that grid operators pay for the energy fed back into the grid. This policy is behind the rapid expansion of solar PV in China, Germany, and other countries. Nevertheless, from 2019, governments started to lower their FiT. For example, China reduced its FiT by 25% compared to 2018 or 45% compared to 2016. Germany also cut its FiT for PV rooftop systems between 40 to 750kW from 2019. This recent change in policy seems to be various governments’ responses to the drop in the cost of photovoltaic systems.
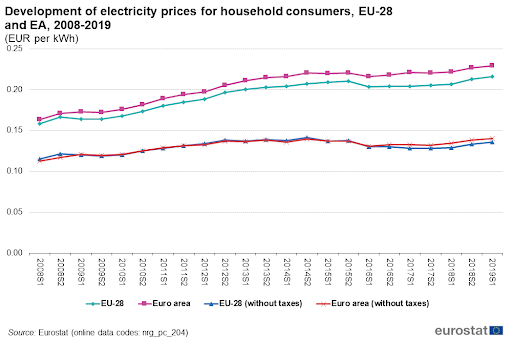
Another action taken by governments is to increase the electricity price. The price of household electricity increased slightly in Europe during the last decade, mainly because of the tax increase. =”_blank” rel=”noopener”>ITRP)
Feed-in tariff for utility-scale PV in China 2019 (CNEP)
Development of electricity prices for household consumers of EU countries 2008-2019 (Eurostat)
Because of higher electricity prices and lower FiT, solar PV system developers are more and more interested in the LCOE. If the cost to produce electricity from solar minus FiT is lower than electricity from fossil fuels, then solar energy is the way to invest. Solar provides a good return on investment as well as protecting the environment. The data from 2018 was encouraging since it showed that the LCOE index of utility-scale and commercial PV is already lower than coal. Toward 2020 solar LCOE is expected to decrease even more thanks to declining PV modules prices and higher efficiency modules.
Solar electricity generation cost in comparison with conventional power sources 2018 (GMOPV)
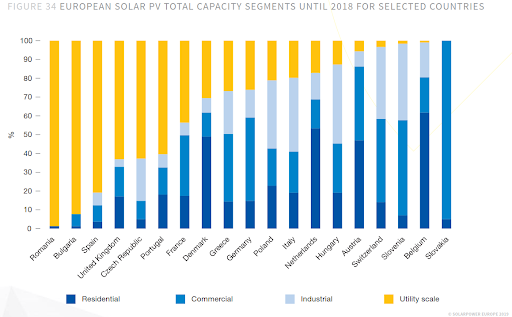
European solar PV total capacity segments until 2018 (GMOPV)
Trends in Cutting the cost of technologies
Production Capacity Expansion
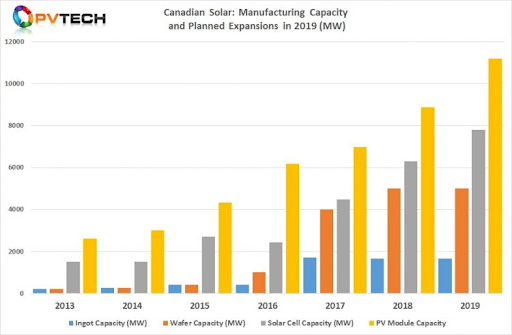
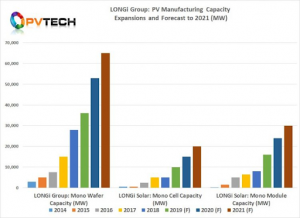
Leading PV module manufacturers expand their production yearly to satisfy global market demands and contribute to cost reduction. This trend of production expansion will go on as the trend of electricity demand gets more substantial and nonrenewable fuel power plants continue their diminution.
Annual World PV module production 2005-2018 (LCEO)
Canadian Solar Manufacturing Capacity and Planned Expansions 2019 (PV Tech)
Longi Manufacturing Capacity and Planned Expansions to 2021 (PV Tech)
Wafers
Recently, the mono-crystalline silicon wafer is gaining momentum and conquering the global solar PV market. A module with a mono-wafer has higher efficiency and fewer defects than a multi-crystalline wafer. We expect to see mono-technology dominating in the following years.
In addition to mono-wafer tech, manufacturers are adopting bigger wafer sizes to increase the power output from a single module. Canadian Solar already introduced their HiKu module with 165x165mm wafers which increases the power output of the 72x poly-half cells module from 360Wp to 410Wp. However, this larger wafer requires a degree of change or renovation in the production line, which could be difficult for manufacturers to do overnight.
Soon after commercialized production, PERC (Passivated Emitter Rear Contact) cells became the standard for PV cells. PERC technology brings cell efficiency up to 1% with a slight modification in production. For the next couple of years, the conventional BSF (Back Surface Field) cells will still exist, but they will quickly be replaced by PERC cells.
The next evolution after PERC is likely to become TOPCon (Tunnel Oxide Passivated Contact) technology which uses a sophisticated passivation scheme and promises to improve efficiency even more. This TOPCon technology will most likely be combined with the n-type mono wafer to achieve maximum efficiency gain. Another advantage of this technology is the manufacturer’s reduced effort to renovate the production line from PERC to TOPCon compared to HJT (Heterojunction Technology).
Utilizing busbar numbers on PV cells always presents an optimization problem. More busbars means more electrons can be collected and the mechanical strength of the cell is stronger; however, it also takes up more inactive area on the cell surface, which reduces efficiency. In the future, multi-busbars will certainly go up to 12% and SWCT (Smart Wire Connection Technology) would be then used to optimize electron collection, in turn minimizing shade on the cells surface.
The technological change of wafers and cells in the PV module will result in a higher power output. Modules with a power output over 400 Wp will be able to cut BOS costs significantly.
At the module level, the most notable change would be for the bifacial module. Indeed, bifacial cells could be used in a bifacial module with a transparent back sheet. They can also be used in a mono facial module with a design that would reflect the light from a white back sheet to the cell.
Bifacial cells could be made from different technologies, from PERC to HJT. Bifacial modules have great potential to become vital on utility-scale PV power plants thanks to their high potential gains.
Module power for 72-cell / 144-half-cell modules (ITRP)
The inverter, a crucial component of the PV system, converts the DC current from PV modules to AC current to feed the grid or to be used in households. Inverters are also getting “smarter” which enables not only monitoring but also to diagnostics of the PV system and suggestion of different solutions to reduce the O&M costs.
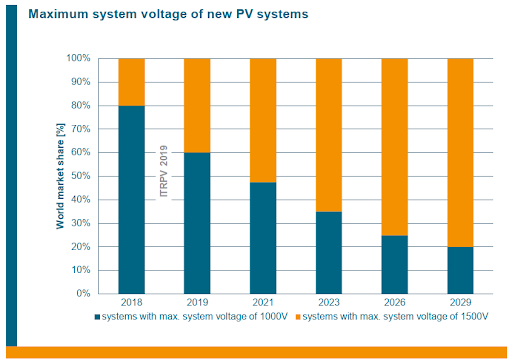
On the one hand, the inverters power output is getting higher, for example the string inverter SUN 2000-185KTL-H1 from Huawei could provide up to 185kW output AC power. Not only is there a DC safety switch, but SPD type 2 DC and AC are already integrated inside the inverter. These features reduce the BOS cost for the project and the installation time. Larger inverters also allow to use higher system DC voltage – up to 1500Vdc, which in turn allows longer string and reduces BOS even further.
On the other hand, the concept of a module-level optimized PV system is becoming more popular for commercial and residential size systems. Optimizing the system with SolarEdge optimizers is an attractive solution and sometimes is the only viable way for heavy shaded areas.
As the price of battery storage is decreasing, combined with a lower FiT trend, consumers are now heading to increase their self-consumption ratio. Generally, with an Energy Storage System (ESS) surplus, PV energy produced during the day will be stored in the battery and used during the evening.
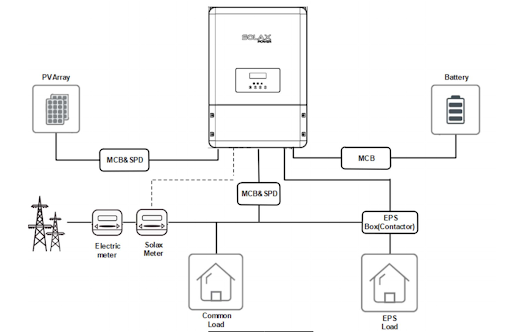
Hybrid inverters such as the Solax Hybrid inverter provide an affordable and simple solution not only for self-consumption but also as a back-up option in case of grid failures.
Electric vehicles (EVs) are becoming more and more popular. Dozens of cities around the world are predicted to ban diesel and gasoline cars in the near future. EVs are also improving in terms of price and usability. The quick charge solution enables “refueling” of an EV in a matter of minutes, not hours as was the case with earlier models.
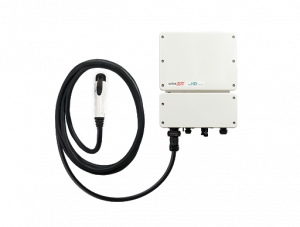
SolarEdge has followed the trend and offers the World’s First 2-in-1 EV Charger and Solar Inverter, which allows charging of the EV directly from the PV system.
Lithium-ion battery price, historical and forecast (ITRP)
A hybrid residential PV system with Solax Hybrid inverter
SolarEdge World’s First 2-in-1 EV Charger and Solar Inverter